
![]()
Jigsaws
Sounds
Video
Custom Shows
vba code
NaviSlides
Games for teachers
Bullets
Triggers
Security
Flash Cards
Multiple Instances
PowerPoint 2007
Mail Merge
Random events
Animation
Hyperlinks
Set spellcheck language
PowerPoint Chart Animation
Here is how to add an animation to a chart in PowerPoint so that the lines draw themselves with each click. The principle will be exactly the same with bar or column graphs.
First add a WIPE animation. In 2010 choose "From left" in Effect Options. In earlier versions you will need to double click the entry in the animation pane to get to Effect options.
If you run the show now the whole chart will wipe in. This is NOT what we need!
In the animation pane double click the entry and select the Chart animation Tab.
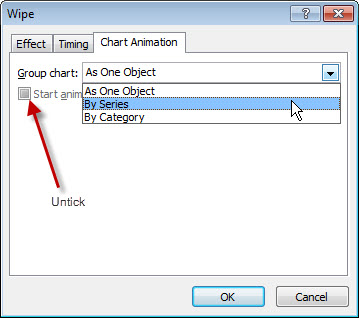
The settings we need are:
Group Chart BY SERIES
Untick START ANIMATION BY DRAWING CHART
Now the lines appear to draw themselves as you click.
With other graph types select the direction of wipe appropriate to the chart.
Articles on your favourite sport
Free Microsoft PowerPoint Advice, help and tutorials, Template Links
This website is sponsored by Technology Trish Ltd
© Technology Trish 2007
Registered in England and Wales No.5780175
PowerPoint® is a registered trademark of the Microsoft Corporation